Biden Administration approves first major offshore wind project in U.S. waters
May 11, 2021
by Paul Ciampoli
APPA News Director
May 11, 2021
Secretary of the Interior Deb Haaland and Secretary of Commerce Gina Raimondo on May 11 announced the approval of the construction and operation of the Vineyard Wind project, the first large-scale, offshore wind project in the U.S.
The 800-megawatt Vineyard Wind energy project, which will contribute to the Biden Administration’s goal of generating 30 gigawatts of energy from offshore wind by 2030, will be located approximately 12 nautical miles offshore Martha’s Vineyard and 12 nautical miles offshore Nantucket in the northern portion of Vineyard Wind’s lease area.
The May 11 Record of Decision (ROD) grants Vineyard Wind final federal approval to install 84 or fewer turbines off Massachusetts as part of an offshore wind energy facility.
According to the ROD for the project, the project would deliver power to the New England energy grid to contribute to Massachusetts’s renewable energy requirements—particularly, the Commonwealth’s mandate that distribution companies (IOUs) jointly and competitively solicit proposals for offshore wind energy generation.
The ROD is jointly signed by and addresses permitting decisions by the Bureau of Ocean Energy Management, U.S. Army Corps of Engineers, and the National Marine Fisheries Service within the National Oceanic and Atmospheric Administration.
Prior to construction, Vineyard Wind must submit a facility design report and a fabrication and installation report. These engineering and technical reports provide specific details for how the facility will be fabricated and installed in accordance with the approved construction and operations plan.
In addition to the May 11 announcement, since January 20, the Department has initiated the environmental review of two other offshore wind projects, and pursued additional leasing opportunities in the New York Bight.
The Departments of Interior, Energy and Commerce on March 29 announced a shared goal to deploy 30 GW of offshore wind in the U.S. by 2030.
At a White House forum, Interior announced the final Wind Energy Areas (WEA) in the New York Bight, an area of shallow waters between Long Island and the New Jersey coast.
The goal of the Department’s area identification process is to identify the offshore locations that appear most suitable for wind energy development, taking into consideration coexistence with ocean users, Interior noted.
The WEAs are adjacent to the greater metropolitan Tri-State area of New York, New Jersey, and Connecticut.
Interior’s BOEM has identified nearly 800,000 acres as WEAs in the New York Bight. The BOEM will initiate an environmental review, with public input, on these areas in federal waters for potential offshore wind leasing.
In addition, Interior in March 2021 said it was initiating an environmental review of the third commercial scale offshore wind project by announcing a notice of intent to prepare an environmental impact statement (EIS) for Ocean Wind LLC’s proposed project offshore New Jersey.
Ocean Wind has proposed an offshore wind project with a total capacity of 1,100 MW.
N.Y. stakeholders, including LIPA, adopt plan for power line for offshore wind farm
A group composed of the New York State Public Service Commission and more than a dozen stakeholders, including the Long Island Power Authority (LIPA), recently agreed to and adopted a plan to build a transmission line that would link a proposed offshore wind farm to the state’s power grid.
In a recent episode of Public Power Now, Tom Falcone, CEO of LIPA, discussed offshore wind.
In August 2019, the New York Power Authority shared key results from a study of European offshore wind transmission models that will help guide New York State as it moves aggressively towards its offshore wind goal by and inform regional and national offshore wind development.
SRP to more than double utility scale solar to 2,025 megawatts by 2025
May 4, 2021
by Paul Ciampoli
APPA News Director
May 4, 2021
Salt River Project (SRP) on May 3 unveiled plans to more than double its 2025 utility-scale solar commitment to now add a total of 2,025 megawatts (MW) of new utility-scale solar energy to its power system by the end of fiscal year 2025, driven in part by dedicated customer demand for new renewables.
This is more than 1,000 MW beyond SRP’s original 2025 commitment of 1,000 MW announced in November 2018, the Arizona-based public power utility noted.
As part of this 1,025 MW solar increase, 450 MW is enabled by an SRP commercial customer to meet its renewable energy commitments. All the renewable energy purchased is expected to be from solar energy developments built in Arizona or on the Navajo Nation and will ultimately be used by SRP commercial and residential customers.
SRP currently has 648 MW of utility-scale solar plants online or contracted and under development across the state and will add more than 1,375 MW of newly contracted solar power by 2025.
SRP recently contracted for the output from the Sonoran Energy Center, which will be the largest solar-charged battery project in the state, giving SRP one of the largest commitments to energy storage in the nation, it said.
The utility has also contracted for an additional large-scale solar and battery storage project at Pinal Central Solar Energy Center and is bringing online a new grid-charged battery storage project at Agua Fria Generating Station.
SRP’s latest solar field developments which came online in December 2020 include the 100 MW East Line Solar and the 100 MW Saint Solar. The two utility-scale solar fields serve commercial, municipal and educational customers who chose to participate in SRP’s Sustainable Energy Offering.
East Line Solar was built by developer sPower and is located in the town of Coolidge in Pinal County, Ariz., and solely serves Intel Corporation with 100 MW of renewable solar energy. Saint Solar was built by developer NextEra and is also located in Coolidge, Ariz., and customers currently receiving a portion of the 100 MW of renewable energy from this solar plant include Air Products, Albertsons Companies, Inc., City of Chandler, City of Mesa, City of Phoenix, CMC Steel Arizona, CyrusOne, Digital Realty, Freeport-McMoRan, Mesa Public Schools and Walmart.
Another utility-scale solar plant part of SRP’s Sustainable Energy Offering is Central Line Solar, a 100 MW solar field to soon be built by developer sPower in Eloy, Ariz., that will serve 21 SRP companies with renewable energy once the plant becomes operational in December this year.
Customers who will receive renewable energy from Central Line Solar include Apple, Inc., Arizona State University, Boeing, CenturyLink, Chandler Unified School District and Circle K Stores, among others.
SRP is already in the process of procuring the additional 1,025 MW of solar capacity from solar developers interested in building new generation resources in Arizona, it noted.
Washington governor tours Snohomish County PUD’s unique microgrid site
May 4, 2021
by Paul Ciampoli
APPA News Director
May 4, 2021
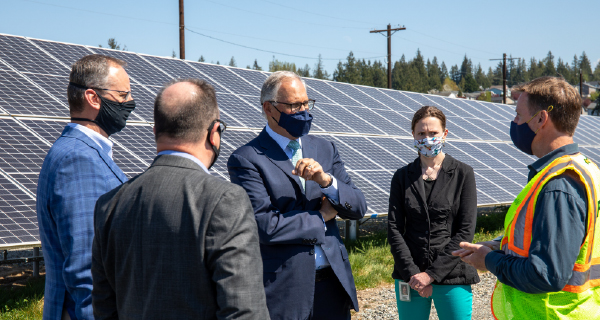
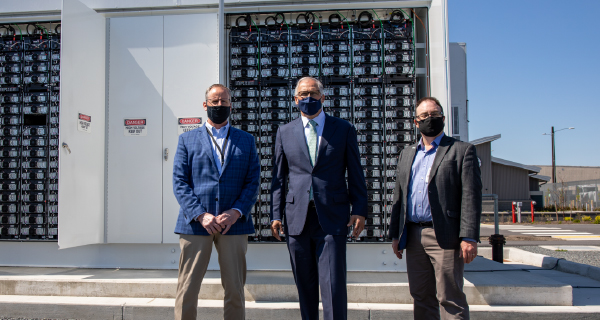
Washington State Gov. Jay Inslee, a Democrat, recently visited a Snohomish County PUD microgrid site. The Arlington microgrid is currently undergoing testing and commissioning and should be fully operational in a few months.
In 2018, the PUD received a grant from the state’s Clean Energy Fund to help build the Arlington microgrid. In fact, the grant covered a quarter of the costs to make the project feasible for the PUD, said Aaron Swaney, a Snohomish County PUD spokesperson, who noted that Inslee has been a champion of clean energy in the state of Washington.
The Arlington Microgrid project is funded in part by a $3.5 million grid modernization grant from the Clean Energy Fund, noted Washington State Department of Commerce Managing Director Jennifer Grove.
“We’re excited to support projects like this that demonstrate how clean energy technologies such as battery storage and solar can work together to provide the community with renewable energy and grid resilience. Commerce is accepting applications for the next round of grid modernization grants through 5 p.m. on May 18, with a focus on funding and technical assistance for earlier-stage planning and design efforts,” she said.
Inslee was interested in the progress of the project, Swaney said.
The microgrid is a very unique project, Swaney pointed out. “More than just a ‘microgrid,’ the innovative project is designed to demonstrate the multiple uses of energy storage: grid resiliency, renewable energy integration, grid support and electric vehicle integration,” Swaney said.
On top of that, the microgrid “could play a critical role in helping the PUD restore power in the case of a devastating earthquake in our region,” he said.
The area where the microgrid is built is near the Arlington Airport and a growing hub of industrial and commercial activity, including the recently announced development of a large Amazon facility.
Inslee received a brief tour of the different elements that make the microgrid unique:
- The Clean Energy Center, an educational hub that will host students and industry workers wanting to learn about the project;
- The Vehicle-to-Grid charging system;
- The 1 MW/1.4 MWh lithium-ion battery storage system; and
- A PUD 500-kilowatt Community Solar array.
PUD Arlington Microgrid Project Manager Scott Gibson led the tour of the V2G and battery storage system, while Community Solar Project Manager Suzy Oversvee talked about the PUD’s investment in Community Solar.
Inslee also chatted and joked with four members of a PUD Substation Construction crew who helped build the microgrid, Swaney said.
Swaney said that the project is undergoing testing and commissioning and should be fully operational by early July. “We are anticipating hosting a virtual ribbon cutting in late August,” he said.
There are many aspects of the project that are innovative, but three are truly unique and being studied closely, he said.
The pair of Mitsubishi Electric V2G chargers on site are one of the first utility deployed (non-demonstration) projects of its kind in the U.S. Nissan is a partner and Pacific Northwest National Laboratories is studying the use of V2G technology.
Second, the Hitachi-ABB PowerGrid’s Grid Forming Inverter helps ensure there is no power loss during the battery’s transition from powering the grid to acting like a generator to power the facilities on site. The University of Texas is studying the Grid Forming Inverter.
Finally, the PUD collaborated with several parties including Burns & McDonnell, Pacific Northwest National Laboratory (PNNL), MESA Alliance, other utilities, and the Arlington Fire Department (AFD) to create a battery storage system that maximizes functionality and safety.
“The battery fire suppression system was a great collaboration between PNNL and the AFD to create a system that is arguably the safest in the country if not the world,” Swaney said.
“We are planning to use this system to provide back-up power to a future office being constructed on the site (anticipated completion 2023),” said Gibson. “We are currently testing the system on the recently completed Clean Energy Center so that when it comes time to connect to the new office – we know that everything works.”
Experts see cost of wind power declining by nearly 50% by 2050
April 27, 2021
by Peter Maloney
APPA News
April 27, 2021
The cost of wind energy is expected to decline by as much as 35 percent by 2035 and by almost 50 percent by 2050, according to a survey conducted by Lawrence Berkeley National Laboratory.
The experts responding to the Berkeley Lab survey estimated median reductions in the levelized cost of energy (LCOE) for wind power of 17 to 35 percent by 2035 and of 37 to 49 percent by 2050.
Participants in the survey focused on five core LCOE inputs: capital costs, operating expenditures, energy output (capacity factor), project life in years, and financing costs (after-tax, nominal weighted-average cost of capital).
The reductions are driven by larger and more efficient wind turbines, lower capital and operating costs, and other advancements, according to the survey findings, which were published in the journal Nature Energy.
The study summarized a global survey of 140 wind experts who considered three types of wind applications: onshore (land-based) wind, fixed-bottom offshore wind, and floating offshore wind. The anticipated future costs for all three types of wind energy were half of what experts predicted in a similar study Berkeley Lab conducted in 2015.
“Wind has experienced accelerated cost reductions in recent years, both onshore and offshore, making previous cost forecasts obsolete,” Ryan Wiser, senior scientist at Berkeley Lab, said in a statement. “The energy sector needs a current assessment.”
The Berkeley Lab survey complements other cost evaluation methods and sheds light on the uncertainties in those estimates, Wiser said. For instance, cost reductions could be relatively modest, as reflected in the lower end of the estimates, but there is also “substantial room for improvement” with reductions even greater than experts predict. There is a 10 percent chance that cost reductions will be in the 38 to 53 percent range by 2035 and in the 54 to 64 percent range by 2050, the study found.
The experts surveyed also anticipate greater absolute reductions – and more uncertainty – in the LCOE for offshore wind compared with onshore wind but see a narrowing gap between fixed-bottom and floating offshore wind.
The survey also revealed that one of the key drivers in cost reductions is improvements in wind turbine sizes. The average capacity ratings of onshore wind turbines are expected to rise to 5.5 megawatts [MW] in 2035 from 2.5 MW in 2019 as rotor diameters and hub heights also increase.
The experts said they expect offshore wind turbines to get even larger, rising to 17 MW on average in 2035, from 6 MW in 2019.
The experts also said they see floating offshore wind gaining market share, growing from its current pre-commercial state to capturing up to 25% of new offshore wind projects by 2035.
“All else being equal, these trends will enable wind to play a larger role in global energy supply than previously thought while facilitating energy-sector decarbonization,” Joachim Seel with Berkeley Lab and a co-author of the study, said in a statement.
Berkeley Lab took the lead in the study, which was conducted under the auspices of the IEA Wind Technology Collaboration Programme with funding from the U.S. Department of Energy’s Office of Energy Efficiency and Renewable Energy.
Texas expected to add 10 GW of solar by 2023, according to EIA
April 25, 2021
by Peter Maloney
APPA News
April 25, 2021
Texas is on track to add 10 gigawatts (GW) of utility-scale solar power by year-end 2022, a surge that would represent one-third of 30 GW expected to come online in the U.S. by 2023 and would put the Lone Star State within reach of California’s lead in solar power capacity, according to the Energy Information Administration (EIA).
Texas’ solar power boom began in 2020 with the addition of 2.5 GW of capacity. The EIA’s Preliminary Monthly Electric Generator Inventory now expects the state to add 4.6 GW of solar capacity in 2021 and 5.4 GW in 2022, which will bring total installed solar capacity in Texas to 14.9 GW.
The EIA expects California to have nearly 18 GW of utility-scale solar capacity online by year-end 2022.
With 30.2 GW, Texas leads the nation in wind power capacity, and 2020 was a record year for wind power installations nationwide, but solar power installations are expected to outstrip wind installations between 2020 and 2022, according to the EIA.
The EIA expects almost half of the new generation added over the next two years in Texas will be solar power plants, surpassing wind expected contribution of 35 percent of new generation and natural gas’ expected 13 percent contribution.
The growth in solar power is being spurred by the availability of the federal Investment Tax Credit (ITC), EIA said. Utility-scale solar projects that begin construction in 2021 or 2022 are eligible for a 26 percent tax credit. The tax credit drops to 22 percent for projects that start in 2023 and to 10 percent for projects that start in 2024 or later.
The growth in solar power is also being driven by declining costs and, particularly in the Permian Basin in West Texas, plentiful sunlight. Between 2013 and 2018, average capacity weighted construction costs for utility-scale solar generation fell 50 percent while costs for wind fell 27 percent and costs for natural gas fell 13 percent, according to the EIA.
In addition, because most solar power is generated during the middle of the day when wind generation is typically lower, Texas has available transmission capacity to handle the increase in solar output, the EIA report noted.
Despite the recent growth of solar capacity in Texas, utility-scale solar still only made up 4 percent of the state’s generating capacity in 2020 and 2 percent of in-state generation, the EIA noted. Natural gas-fired generation made up 53 percent of Texas’s capacity in 2020 and 52 percent of in-state generation. Wind power comprised 23 percent of the state’s capacity and 20 percent of in-state generation.
Last November, three Texas public power cities – Bryan, Denton and Garland – entered into agreements to buy energy from a 1,310-megawatt solar plant that is expected to be the largest solar farm in the nation when it is completed in 2023.
Virgin Islands Water and Power Authority board OKs wind power purchase agreement
April 25, 2021
by Paul Ciampoli
APPA News Director
April 25, 2021
The Virgin Islands Water and Power Authority’s (WAPA) governing board recently approved a wind power purchase agreement between WAPA and Advance Power LLC.
Under terms of the agreement, Advance Power will develop, finance, permit, design, construct, test, operate and maintain a wind farm at Bovoni Point on St. Thomas.
Project completion is expected within 24 months of the effective date of the contract.
The wind facility, comprised of six wind turbine generators, will produce approximately 10 MW of wind energy that will be sold to WAPA.
Advance Power was the most responsive bidder to a request for proposals issued in April 2017 and negotiations have been underway since August 2017, WAPA said in a news release.
WAPA Interim Executive Director and CEO Noel Hodge said the wind facility will compliment several other similar renewable projects the Authority is pursuing as part of a federally funded strategic transformation plan.
Hodge noted that WAPA has applied to the Federal Emergency Management Agency for approval of solar and wind projects “as we move the needle forward in diversifying our generation mix. We recognize the need for the Authority to reduce its reliance on fossil fuels to generate electricity, and where feasible, WAPA will pursue projects that allow harnessing energy from lower cost sources such as solar and wind.”
Hodge said that the reduction of reliance on fossil fuel for electrical generation will result in operational savings to WAPA and lower the cost of electricity to customers.
The approved agreement lays the foundation for the development of a wind farm capable of generating about a sixth of the total peak power consumption on St. Thomas, WAPA said.
A report by the National Renewable Energy Laboratory (NREL) identified the site for wind generation as early as 2012. The report estimated the total capacity of a Bovoni wind farm as between 7,000 and 29,000 megawatt hours per year.
“The wide range of potential energy generation represented by these estimates is a function of the total installed plant size, which is in turn limited by the number of turbines that can be placed on Bovoni Point and varying levels of productivity associated with specific turbine designs,” a summary of the report said.
WAPA said that the report also estimated that the cost of generation would be much lower than the cost of oil or liquid petroleum gas-based generation.
The governing board voted unanimously on March 25 to approve the agreement with Advance Power.
OPPD signs PPA for output of 81-MW solar farm
April 16, 2021
by Peter Maloney
APPA News
April 16, 2021
The Omaha Public Power District (OPPD) has signed a power purchase contract with Community Energy for an 81-megawatt (MW) solar farm.
Renewable energy sources are central to OPPD’s Power with Purpose project, which includes a commitment to its board of directors to add up to 600 MW of utility-scale solar to OPPD’s fleet, along with modernized natural gas backup generation at its Turtle Creek and Standing Bear Lake stations, according to The Wire, the utility’s online newsletter.
The planned Platteview Solar project will be one of several solar facilities supporting OPPD’s 13-county service territory, according to The Wire. OPPD also plans to grow its renewable energy portfolio, which includes wind, hydro, landfill gas, and a 5-MW community solar facility, from its current 38.4 percent of retail sales as of 2020.
OPPD is striving to be a net-zero carbon utility by 2050 under a strategic directive set up by its board of directors. Power with a Purpose came out of the board’s directive. OPPD has also begun a broader study, Pathways to Decarbonization, that is looking at the utility’s generation portfolio, internal operations, buildings, fleet and inventory, as well as community engagement regarding customer-owned generation, OPPD spokesman Cris Averett said. “We want to be part of that conversation,” he said.
The study is slated to continue for the rest of the year. OPPD would then report back to its board, which would then make recommendations to the utility.
The Platteview Solar project is sited on about 500 leased acres south of Yutan, Neb., in eastern Saunders County. It will be owned and operated by Radnor, Penna., based Community Energy, which was chosen for the project through a competitive bidding process.
Community Energy is in the process of securing a conditional use permits for the solar project. Pending approval, construction of the solar project would begin early in 2022 and take nine to 12 months to complete. “We are hoping for a green light by the summer,” Averett said.
In February, Saunders County passed a solar ordinance, stipulating required setbacks and a plan for funded site decommissioning at the end of the solar farm’s useful life, approximately 30 years.
The project will employ more than 150 people for up to a year. Longer term, up to three full-time employees would operate and maintain the site and Saunders County would receive around three decades of tax revenue with little to no effect on local services and infrastructure, according to The Wire. “It will be an economic boon for the county,” Averett said.
Public power utilities recognized for their efforts to shift to modern, carbon-free energy systems
April 15, 2021
by Paul Ciampoli
APPA News Director
April 15, 2021
Five public power utilities have been recognized by the Smart Electric Power Alliance (SEPA) for their efforts to transition to a modern and carbon-free energy system.
SEPA noted on April 14 that it launched the inaugural Utility Transformation Challenge to make a comprehensive, honest assessment of U.S. electric utilities’ progress towards a modern, carbon-free energy system.
SEPA said it conducted and analyzed multiple surveys designed to measure meaningful progress across multiple dimensions of utility infrastructure, programs, strategy and operations. Insights derived from these survey results form the basis for a new report: the 2021 Utility Transformation Profile.
SEPA received survey responses from 135 individual utilities, representing more than 83 million customer accounts, or approximately 63% of all U.S. electric customer accounts.
The report examines the utility industry’s transition to a clean and modern energy system by exploring four dimensions of utility transformation: clean energy resources, corporate leadership, modern grid enablement, and aligned actions and engagement.
With respect to what was learned from evaluating the utilities leading the clean energy transition, SEPA listed the following:
- Explicit commitments to carbon reduction are an important and necessary first step for utilities. Utilities with stronger commitments have made the most progress;
- The transformation goes beyond clean energy resources. A comprehensive approach is needed that touches all dimensions of the utility business and operations;
- A transformation of utility culture is necessary. Leadership, transparency and accountability facilitate the transition to a clean and modern future; and
- Utilities can’t achieve a carbon-free system alone. Leading utilities are proactively and strategically working with stakeholders to facilitate the transformation.
Utility Transformation Leaderboard
SEPA also unveiled the 2021 Utility Transformation Leaderboard, which SEPA said recognizes the ten utilities that have demonstrated the greatest progress in the transition.
Five of the 10 utilities on the leaderboard (in alphabetical order) are public power utilities (bolded):
- Austin Energy (Texas)
- Consolidated Edison of New York
- Green Mountain Power
- Holyoke Gas and Electric Department (Massachusetts)
- Los Angeles Department of Water and Power
- Pacific Gas & Electric
- Sacramento Municipal Utility District (California)
- San Diego Gas & Electric
- Seattle City Light
- Southern California Edison
“I am grateful for this prestigious recognition from the Smart Electric Power Alliance and appreciate the hard work of HG&E employees,” said James Lavelle, Manager of Holyoke Gas & Electric.
“As a municipal public power utility, HG&E is committed to providing innovative and sustainable energy solutions to our community through investments in a diverse power supply portfolio, energy storage, efficiency and conservation programs, as well as development of emerging clean energy technologies,” he said. “The State of Massachusetts has established a road map to net-zero by 2050 and HG&E is well positioned to meet this goal, as well as the incremental targets set for 2030 and 2040.”
“We are honored to be a part of SEPA’s Utility Transformation Challenge,” Seattle City Light General Manager and CEO Debra Smith said. “I think we all recognize the need to transform is a constant in our lives, businesses, and society. Creating a carbon-free energy system is never truly complete. City Light will continue to lead these efforts as our region moves toward a cleaner energy future.”
“We’re proud to be leading the way in decarbonizing our economy,” said SMUD CEO and General Manager Paul Lau. “We’re at a point where we must commit to ambitious goals in order to achieve meaningful carbon reductions that benefit our community and the world. Creating an inclusive, clean, green economy will improve economic, health and environmental outcomes, as well as drive a new, clean workforce and that’s something everyone can be excited about,” said Lau.
“We are honored to be on SEPA’s 2021 Utility Transformation Leaderboard,” said Jackie Sargent, Austin Energy General Manager. “Austin Energy is committed to grid modernization and affordable, carbon-free energy as approved by the Austin City Council. Inclusion on this list reinforces how important it is for the utility to continue these efforts and remain an industry leader.”
SEPA offers recommendations
SEPA provided recommendations for utilities of all sizes, types and geographies as they pursue their own path of transformation.
SEPA recommended utilities strengthen carbon reduction commitments by setting ambitious, science-based targets with interim goals and detailed plans to achieve them.
It also recommended that utilities address the transformation comprehensively across the organization through changes to processes, programs and structures that will accelerate clean energy adoption.
Examples include pursuing integrated distribution planning, interconnection processes, evaluating non-wires alternatives (energy efficiency, demand flexibility, storage, etc.) to meet demands, developing a transportation electrification strategy and efficiently integrating and leveraging distributed energy resources.
Utilities should also embrace the clean energy transformation as a core element of the utility mission and culture. “This will require changes, such as linking executive compensation to reduced carbon emissions, establishing transparent emissions tracking and reporting programs and pursuing internal sustainability and carbon reduction programs (e.g., fleet electrification and supply chain programs),” SEPA said.
SEPA also recommended that utilities engage customers, technology partners, peer utilities and regulators early and often. “Common understanding and shared vision of new initiatives and technology deployments is critical to facilitate innovation,” it said.
In addition, SEPA said that utilities should integrate equity considerations and goals into efforts and programs to ensure all community members are able to participate in and benefit from the clean energy transformation.
The 2021 Utility Transformation Profile report and Utility Transformation Leaderboard are available here. Download the executive summary here.
Heartland develops web-based renewable energy calculator with DEED internships
April 12, 2021
by Peter Maloney
APPA News
April 12, 2021
Heartland Consumers Power District in South Dakota has developed a web-based renewable energy calculator using Demonstration of Energy & Efficiency Developments (DEED) internships from the American Public Power Association.
Heartland customers can use the calculator to determine the costs and benefits of installing a renewable energy facility, particularly a solar power array.
In 2019, Heartland initially developed this solar power calculator using a prior DEED internship for funding. Then, in 2020, the utility applied for and won another DEED internship that was used to make a more user friendly version of the original calculator.
Though it was functional and ran well, the original calculator ran on an Excel spreadsheet and used custom macros. Instead, Heartland wanted a version of the calculator that could run with a modern programming language like C# and could be used on any device with a browser such as a tablet or smart phone.
Heartland used its DEED internship to help fund a summer intern, John Kirkvold, a computer science major at South Dakota State University, who wrote the code for the new calculator.
The updated calculator uses data on solar power production from behind-the-meter installations while taking into account weather conditions as well as changing market prices. The calculator also takes into account state regulations that allow customers to sell solar output back to a utility, i.e., net metering. In states without net metering, the calculator uses avoided cost values to determine sale-back values.
After factoring in those variables, the calculator shows the user annual savings in payback time in years it would take a customer to recoup the cost of installing a solar array on their property.
The calculator has assumptions built into it based on the user’s location, which need to be updated periodically. Using a web interface ensures that the latest data is always available to the user.
The aim in designing the calculator was to allow customers to calculate the savings on their annual electric bill, as well as the annual cost to the utility and to the wholesale power entity.
The project also included making data displayed in Heartland’s lobby web functional and able to update automatically, particularly information on Heartland’s resources and generation.
CDE Lightband digs into pros and cons of solar penetration with DEED grant
April 7, 2021
by Peter Maloney
APPA News
April 7, 2021
CDE LIghtband has used a Demonstration of Energy & Efficiency Developments (DEED) grant from the American Public Power Association to conduct and refine an analysis of the effects of solar power penetration on the Tennessee public power utility’s operations.
The DEED project had three goals: develop simple models for forecasting solar adoptions at the local level, compare the modeled solar output with actual solar power output, and evaluate the forecasts of those models on utility revenues and load curves.
The first step in the process was to simulate solar generation. The majority of that work was done by using the National Renewable Energy Laboratory’s System Advisor Model (SAM), modeling software that NREL makes available for free as an aid to decision-makers in the renewable energy industry.
NREL’s software enables planners to model how much power a particular solar array can produce while factoring in variables, such as latitude, seasonal weather, cloud cover, and even the effects of shade from trees at different times of day.
The second step asked the “big question, ‘how accurate is the model for Clarksville?’” Jared Combs, business intelligence analyst at CDE Lightband and author of the DEED report, said.
To do that the CDE Lightband team modeled the output of a 6-kilowatt (kW) photovoltaic solar array in Clarksville using the NREL software. The 6-kW size was chosen because it is the average size of a residential solar array, according to the Lawrence Berkeley National Laboratory.
CDE Lightband also built an actual 6-kW solar array and collected the data on its output and compared those results of the simulated and actual data. “The biggest finding,” Combs said, was that using average weather data as opposed to actual weather data yielded “potentially wildly inaccurate” results. “The simulated results do not align with the actual results unless you use specific year weather data,” he said.
The comparisons show “the importance of using hourly data, modeled on a specific year weather file when conducting a utility solar economic analysis,” Combs wrote in the DEED report. “This means that to analyze demand charge and time-of-use effects specific weather files must be used in the SAM model.”
One of the driving factors behind the analysis made possible by the DEED grant was to come up with a more accurate assessment of the effect of solar penetration and solar output on utility revenues.
Even if a customer is getting most of their power from solar panels on their roof, the utility is still bearing a fixed cost in personnel and equipment such as transformers. “To be fair to customers, we need to find out how much our customers with solar arrays affect our revenues,” Combs said.
Combs ran the modeled solar output data against CDE’s 2018 rates and demand intervals to determine revenue effects. A positive revenue effect is the result of solar output reducing utility wholesale demand charges by more than the amount lost on utility energy revenues less power costs.
Taking reductions in demand charges paid to wholesale power suppliers into account, total utility revenue effects from solar generation were 42 percent lower than when demand charges were not factored in, the analysis showed.
“One of the key findings,” Combs said, was that the revenue affect of a solar array is affected by its orientation. A Southwest facing array, because it catches solar energy in the evening as utility demand is rising, can pay for itself because it can reduce demand charges at a time when the utility is often selling power to customers at a loss, Combs said.
“Understanding of hourly economic interactions between utility wholesale costs and solar array generation might inform strategic planning and various models for distributed energy resource (DER) market participation,” Combs wrote in the DEED report, adding that utilities developing community solar programs “might consider the effect of solar arrays on their wholesale demand charges when calculating investment metrics and pricing models.”
Combs also recommended that “rate adjustments intended to ensure that solar array owners cover their portion of the fixed costs of electric distribution might more accurately consider the value of customer generated solar power.”
Combs cautioned, however, that conditions such as solar irradiance and the relationships between retail and wholesale rate structures often vary hourly and are different from one utility to the next.
One of the benefits of understanding the revenue effects of a single solar array is that that data can be applied as a multiplier against anticipated solar arrays to estimate future net revenue effects of solar adoption on a utility system, Combs said.
As part of the DEED grant, CDE Lightband also analyzed census data to gauge where rooftop solar arrays would be installed. CDE looked at several census traits, such as house size, education levels, and house ages. CDE was aided in its analysis by analytics firm DNV GL. The analysis found that in Tennessee the most predictive characteristic was income. Higher income correlated with higher solar penetration.
Combs cautioned, however, that those results might not hold true for utilities in other areas. It also said it is “advisable that utilities consult expert analysts before taking business action on the results of any PV adoption models or the models intended for economic analysis.”
The cost of building the solar array was about $25,000. CDE Lightband submitted and received a DEED grant for about $10,000. Expenses for data collection, analysis and reporting were assumed by CDE Lightband and Tennessee Valley Authority, which provided the Clarksville utility with assistance, and were not included in the budget.
The DEED grant gave CDE the freedom to collect and thoroughly analyze the solar data in a way that would have been hard to justify otherwise, Combs said. “It was good, not just because it was good for us, but because of the exponential benefit of being able to share the results with other utilities,” he said.
A webinar related to the project was held on April 6. A replay of the webinar is available for purchase at APPA’s product store and will also be shared in the DEED project library.